Related Images and Videos
J. Ryan Rembert's Blog

Inferno, VISIONS '13 LEG 3
Photo credit: NSF-OOI/UW/CSSF

A Dumbo Octopus floats above the lava. VISIONS '13, leg 3.
Photo credit: NSF-OOI/UW/CSSF
2 August 2013
I left the previous post with a vague oversimplification of sorts, tinged with perhaps a minor level of naiveté - continuing from there seems like as good a place to start as any, so without further ado...
"The simple solution is to keep working."
Disclaimer, I'm a healthy cynic by nature, but that part of me and the pugilistic optimist in me are certainly in agreement on one thing: all complexities can eventually distill down to simpler concepts if one takes the time and effort to understand the underlying problems. I believe that attaining this understanding is based on a foundation of hard work, maintaining an open mind (assume nothing), and taking advantage of new technology when available.
On the subject of hard work, one of the great things about being aboard the Thompson isn't just having the opportunity to work with the variety of professionals on board or the projects they are working on (although they are spectacular), but for me it's how they go about it. Everyone understands the challenges in what we are doing, but despite the stress, uncertainty, and sleepless nights, they just keep at the job until it gets done. And they don't settle for "good enough" either; in fact I've never heard that phrase uttered once on board. It only takes one kink in a cable or faulty gasket to undo months and many thousands of dollars of work.
In short, "good enough" is not good enough.
As someone occasionally chastised for micromanaging too much, that attention to detail and inscribed process of quality control is music to my ears. The scientists, engineers, and ship’s crew get the job done, but they get it done the Right Way, and that model only bodes well for the future of the observatory.
Once the RSN turns on the lights and starts beaming data to the masses, how are researchers and citizen scientists going to use this data? How can oceanographic data be used in a broader context? How can we use this data to contribute to managing our health, food supply, coastal infrastructure, culture…the list goes on. Oceanography is a multidisciplinary art that innately touches these issues, but I believe that understanding the new challenges that will arise in the 21st century lie not only in breakthroughs in established disciplines, but also the generation of entirely new scientific disciplines.
There will certainly always be a need for purists, but this new influx of information will hopefully spawn a host of new disciplines focused not only on the relationship between other branches of natural science, but focused on the gradational contacts between natural science and social sciences or non-sciences as well. These new branches will serve as a "middleware" layer, to borrow a software development term, to connect and allow researchers (and even the data itself) to communicate with each other on common terms.
Whether RSN/OOI accomplishes this, or at least sets the wheels in motion, lies ultimately in how people take advantage of this opportunity. From a humble outsider's perspective, it certainly won't be from lack of effort on this end.
31 July 2013
I'm a person known for doing my homework. While I certainly subscribe to a cowboy mentality when I'm inside a project, the precursor is usually a very calculated, methodical analysis of the problem to be solved and the identification of a good vector on which to begin work. As such, I had an idea of the labyrinthian endeavors and innumerable stakeholders involved in RSN, but there is no substitute for understanding the breadth and complexity of a project without being directly on site. And lo and behold, this truism was evident before we had even left Newport (hashtag "thegloriesofbeingcynical").
As one would expect, the issue of complexity in the ocean has been a recurring theme aboard the Thompson and justifiably so. The ocean is the part of the biological pump that inexorably provides the possibility of life. However, what has become increasingly evident to me is that there are far more layers of complexity involved in this cruise than those that tie in directly to the ocean.
Complexity of Communication
How do scientists translate their requirements to the engineers to design the proper equipment for the job? How does the science party communicate dive plans to the ship's crew and ROV engineers to properly (and efficiently) complete expedition objectives? How do we transmit what we're doing out here to the public and in a way that makes sense and justifies our presence? How do students interact with other, more experienced, members of the crew and contribute to cruise operations?
Complexity of Design
Given the constraints of cost and time, how do scientists and engineers properly decide what instruments can be deployed and how long it takes? When operations break down and dive plans change, how do you pivot and react to those changes? How do you decide where to place instruments, how to retrieve data from them, and how to maintain them once deployed?
Complexity of Data
What stories can we tell with the data we are collecting? What stories could other people tell if given access to the data? How can we pool the data from all these sensors and present it in a useful way? How can we tell what is good data and what is bad data? How can we improve how the data is processed and find patterns within the data that can be quantified? Where and how are we storing all this data? How are we archiving this data and how would we recover data that is lost? How would we even know that the data is lost?
And the scary (or exciting, if you're a sadist like myself) thing is: there are layers upon layers of complexity within and around each of these, threaded recursive relationships between layers and sublayers of other disciplines and webs yet to be spun from the inevitable new questions that will arise and further convulute and prevent resolution of the problem.
The Solution
So how do we unravel and make sense of such a vast, multidimensionalintracircumnavigational, seemingly Orouborosian problem? The simple solution (and this carries much more weight if you imagine this delivered with Clint Eastwood's trademark raspiness) is to simply keep working. As the adage (sort of) goes, nothing worth achieving ever comes easy. After all, the adventure isn't the destination but the journey taken and the people you meet along the way.
I'll discuss my thoughts in slightly more detail in my next post, but I've written too much already and dinner is calling.
26 July 2013
This story begins more than two years ago, on June 19, 2011.
According to Google, this was my first ever correspondance with Leslie "Doc" Sautter - it went something (exactly) like so:
"Class will be held in room 241 of the New Science Center (next to the GIS lab).See you at 9 tomorrow! No text. You will need to purchase a 4 MB usb drive asap. That's it! Doc"
While I could probably write a short novel on how that very exchange epitomizes so many aspects of my relationship with Doc since, I mostly recall it now because that brief exchange was truly the first leg in the journey that led me to sail aboard the Thompson at this very moment. A much longer novel could be written about Doc's steady evangelism of marine science and education, not to mention the hundreds (if not thousands) of commerical and academic opportunities she has brought to her students.
I mention this before beginning, not only because it's true and she doesn't get enough credit for what she does, but also because I'm extremely late in getting this blog post out and do not wish to further risk invoking her wrath.
As such, rather than expound upon any number of feverishly abstracted topics I unsuccessfully attempted to write about (maybe in future posts) I'll just start with some cool images of what we're doing and elaborate a bit more on what I'm doing.
Observations from Below
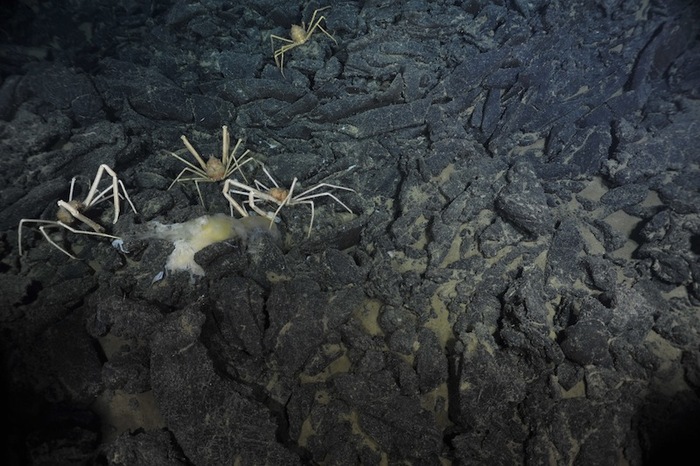
So without further ado, above is a picture of three hungry crabs and one creepily lurking in the back. Macrofaunal life is somewhat sparse at this depth, but when the dinner bell rings you can get a bit of a crowd. Sorry, no crab fights.
And next, in the upper right, a photo of "Inferno," a hydrothermal vent within the ASHES Vent Field at Axial Volcano. Standing about 4 meters high, Inferno is composed of sulfide minerals precipitated out of brine-filled seawater boiled within the vent at a balmy 350+ degrees Celsius. I hear it gives great hugs, but I wouldn't recommend it.
And finally, in the lower right, a photo of an octopus that's taken a liking to cable RS03W10. It's rather tiny (notice the size of J-box leg on the right). This was captured during an operation to gauge the distance between the J-box (MJ01A) and a Primary Node (PN3B). Precision is key when you're deploying finely-tuned, expensive equipment in remote, harsh locations - far better to be safe, than sorry.
What I'm Doing
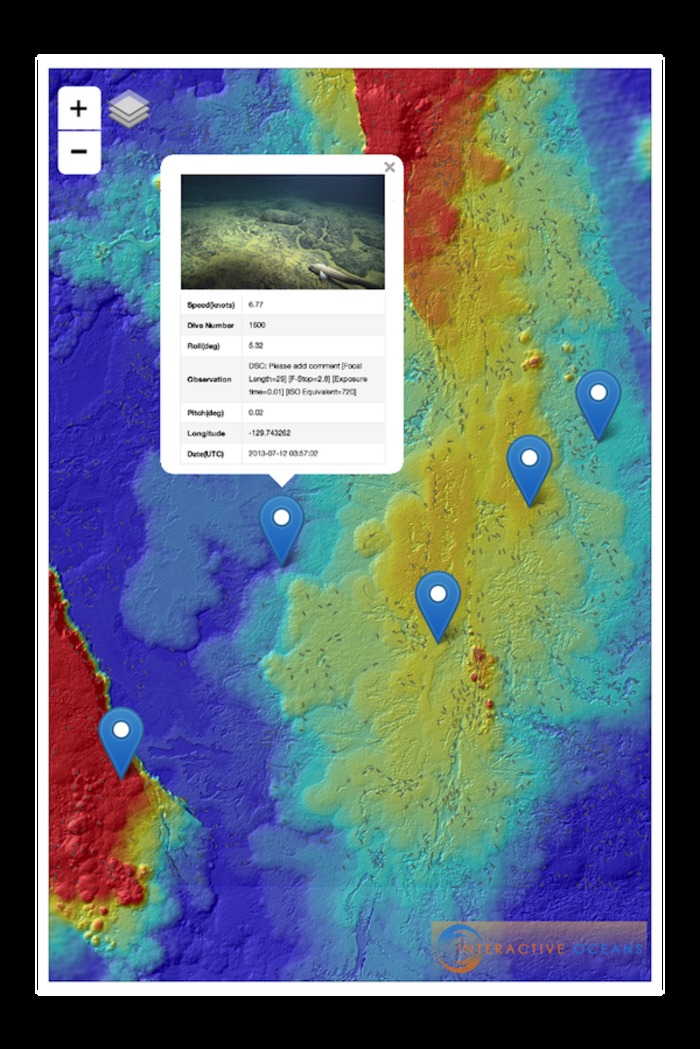
One of the topics that interested me before coming on board was visually communicating the status of the various ROV dives and benthic sensors. There are static maps available of the cabled observation network, high-definition video and photos, and live broadcasts, but no method of communicating data about the cruise in a spatial context.
The sensors themselves are not wired up to the high-bandwidth cabling that will eventually stream data shoreside, but there is a tremendous amount of data captured via IRLS (Integrated Real-time Logging System), the system used to log observations and metadata from each ROPOS dive. I've taken the data from the dives and created a system to translate the observations recorded within the dive logs onto an interactive map with the end goal being something viewable by the public.
There is still work to be done before it is ready to be deployed to the live website, but things are looking promising and I'm hoping to have a preliminary version up by this weekend. Once it's up, I'm hoping to generate one or more blog posts a day with updated iterations of the map to show it's development over the life of the expedition.
Hopefully, some of our viewers will play around with it and even send in specific requests that I could work into the map in future versions. Below is a quick prototype of what the map may look like when finished to provide an idea what I'm trying to do.