Related Images and Videos : View All
Bottom Pressure and Tilt Meter V17
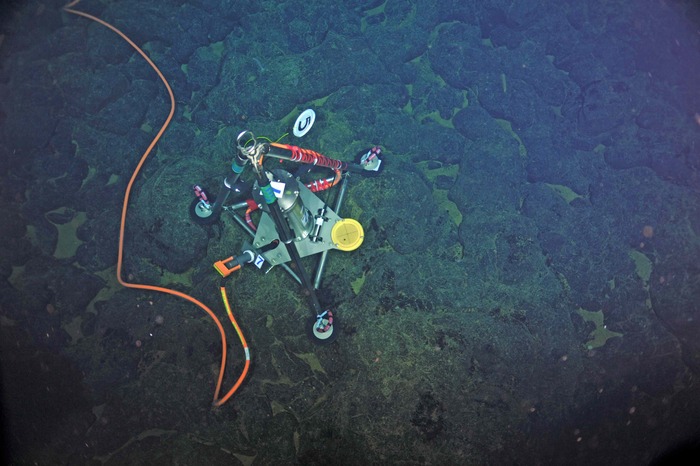

A bottom pressure-tilt instrument is installed at the summit of Axial Seamount in the International District hydrothermal field. This instrument measures the rise and fall of the seafloor due to melt migration in the subsurface. Currently, the seafloor is rising and this is believed to reflect the influx of magma into the core of the volcano.The instrument rests on a frozen lava flow - called a sheet flow. The small black marble in the yellow plate at the instrument base indicates that the platform it level. Photo credit: NSF-OOI/UW/CSSF; Dive R1723; V14.

Data for the Bottom Pressure Tilt (BOTPT) instrument is easily viewed through the OOI Data Portal. This image shows an example of pressure data averaged every 15 seconds as viewed through the quick look option on the Data Portal for the BOTPT instrument at the Central Caldera Site. The large offset shown on April 24, resulted from a 2.4 m drop in the seafloor over an ~ 24 hour period as the volcano was erupting. Credit: OOI-NSF.
The Bottom Pressure and Tilt platform (BOPT) is a custom built instrument developed by Bill Chadwick at NOAA PMEL in Newport, Oregon The BOPT measures the inflation and deflation of the seafloor at the summit of Axial Seamount using a precision pressure sensor that enables detection of the seafloor's rise and fall (i.e., "breathing") as magma (molten rock) moves in and out of the underlying magma chamber. A very precise tilt meter that measures in micro-radians records the "tilting" of the seafloor as it deforms in response to melt-lava migration.
During VISIONS '14, a bottom pressure tilt instrument was installed at the International District 2 Site (MJ03D) and at the Eastern Caldera Site (MJ03E), and at the Central Caldera Site (MJ03F).
The pressure sensor is a Paroscientific Digiquartz pressure transducer and the tilt meter is supplied by Applied Geomechanics (LILY).
An example of the high resolution pressure data collected since 2014 at the Central Caldera Site, from which seafloor uplift and deflation is calculated, can be viewed (and downloaded) through the OOI Data Portal - BOTPT.
